


[Business] Part 4: Finding the Perfect Investment For 2025
Part 4: Understanding & Assessing Industry Metrics

Hi Readers,
Earlier this week I released Part 3 of my series, “Finding the Perfect Investment for 2025“ — I spent quite a lot of time on it trying to get the important details down, and I hope you enjoyed it!
Today, I’m excited to bring you:
Part 4: Understanding & Assessing Industry Metrics
[Part 5 Preview]: Screening, screening, & more screening
My focus will be on understanding which unique metrics in the Energy and Utility Industries matter or are available to analyze, how (if) common assessment techniques are viable for an accurate assessment, and establishing a industry baseline for each metric to compare individual investment opportunity metrics against.

One interesting note I wanted bring up before jumping in is that since writing this, I’ve already seen a few names that jumped out to me during my research POP for very tangible reasons — I’m looking forward to being on the front of these with you in the near future and seeing some money signs.
Without further ado… let’s get started! 🔥 ⬇️
6. Understanding & Assessing Industry Metrics
In the meat & potatoes of this piece, I will be covering the following industry metrics:
A. EBITDA (& EV/EBITDA)
B. Unit Production (Wh), Backlog, & Capacity
C. CAPEX + R&D
D. Debt to Enterprise Value Ratio (D/EV)
E. Interest Coverage Ratio
F. Return on Invested Capital (ROIC)
H. Bonus Metric - motivation to read until the end!

All of these metrics were take-aways from my research into how Energy companies operate specific to the Energy industry, how they (the businesses) think about evaluating performance, and my own research into the financials of numerous investment prospects to gain an understanding of the predictive validity of these metrics and general ranges for each.
"Not everything that can be counted counts, and not everything that counts can be counted." – Albert Einstein
A. EBITDA
EBITDA is the perfect place to start when looking at most industries, but especially so in Energy. The reason for this is because of how capital intensive the Energy industry is. Companies are constantly recycling assets and are continuously upgrading their own infrastructure to remain competitive. Because of this, depreciation tends to be incredibly high, and thus, we want to exclude that as a factor.
To illustrate, take a peek at the graph below for NextEra Energy (NEE) showing extraordinary differences between EBITDA, EPS, and FCF (FCF is negative!). This is because first, depreciation, taxes, & interest are taken out of our EBITDA to get a primarily negative EPS, and then when we move those earnings to the cash flow statement we add back a huge CAPEX number and dividends to get an even more negative FCF.
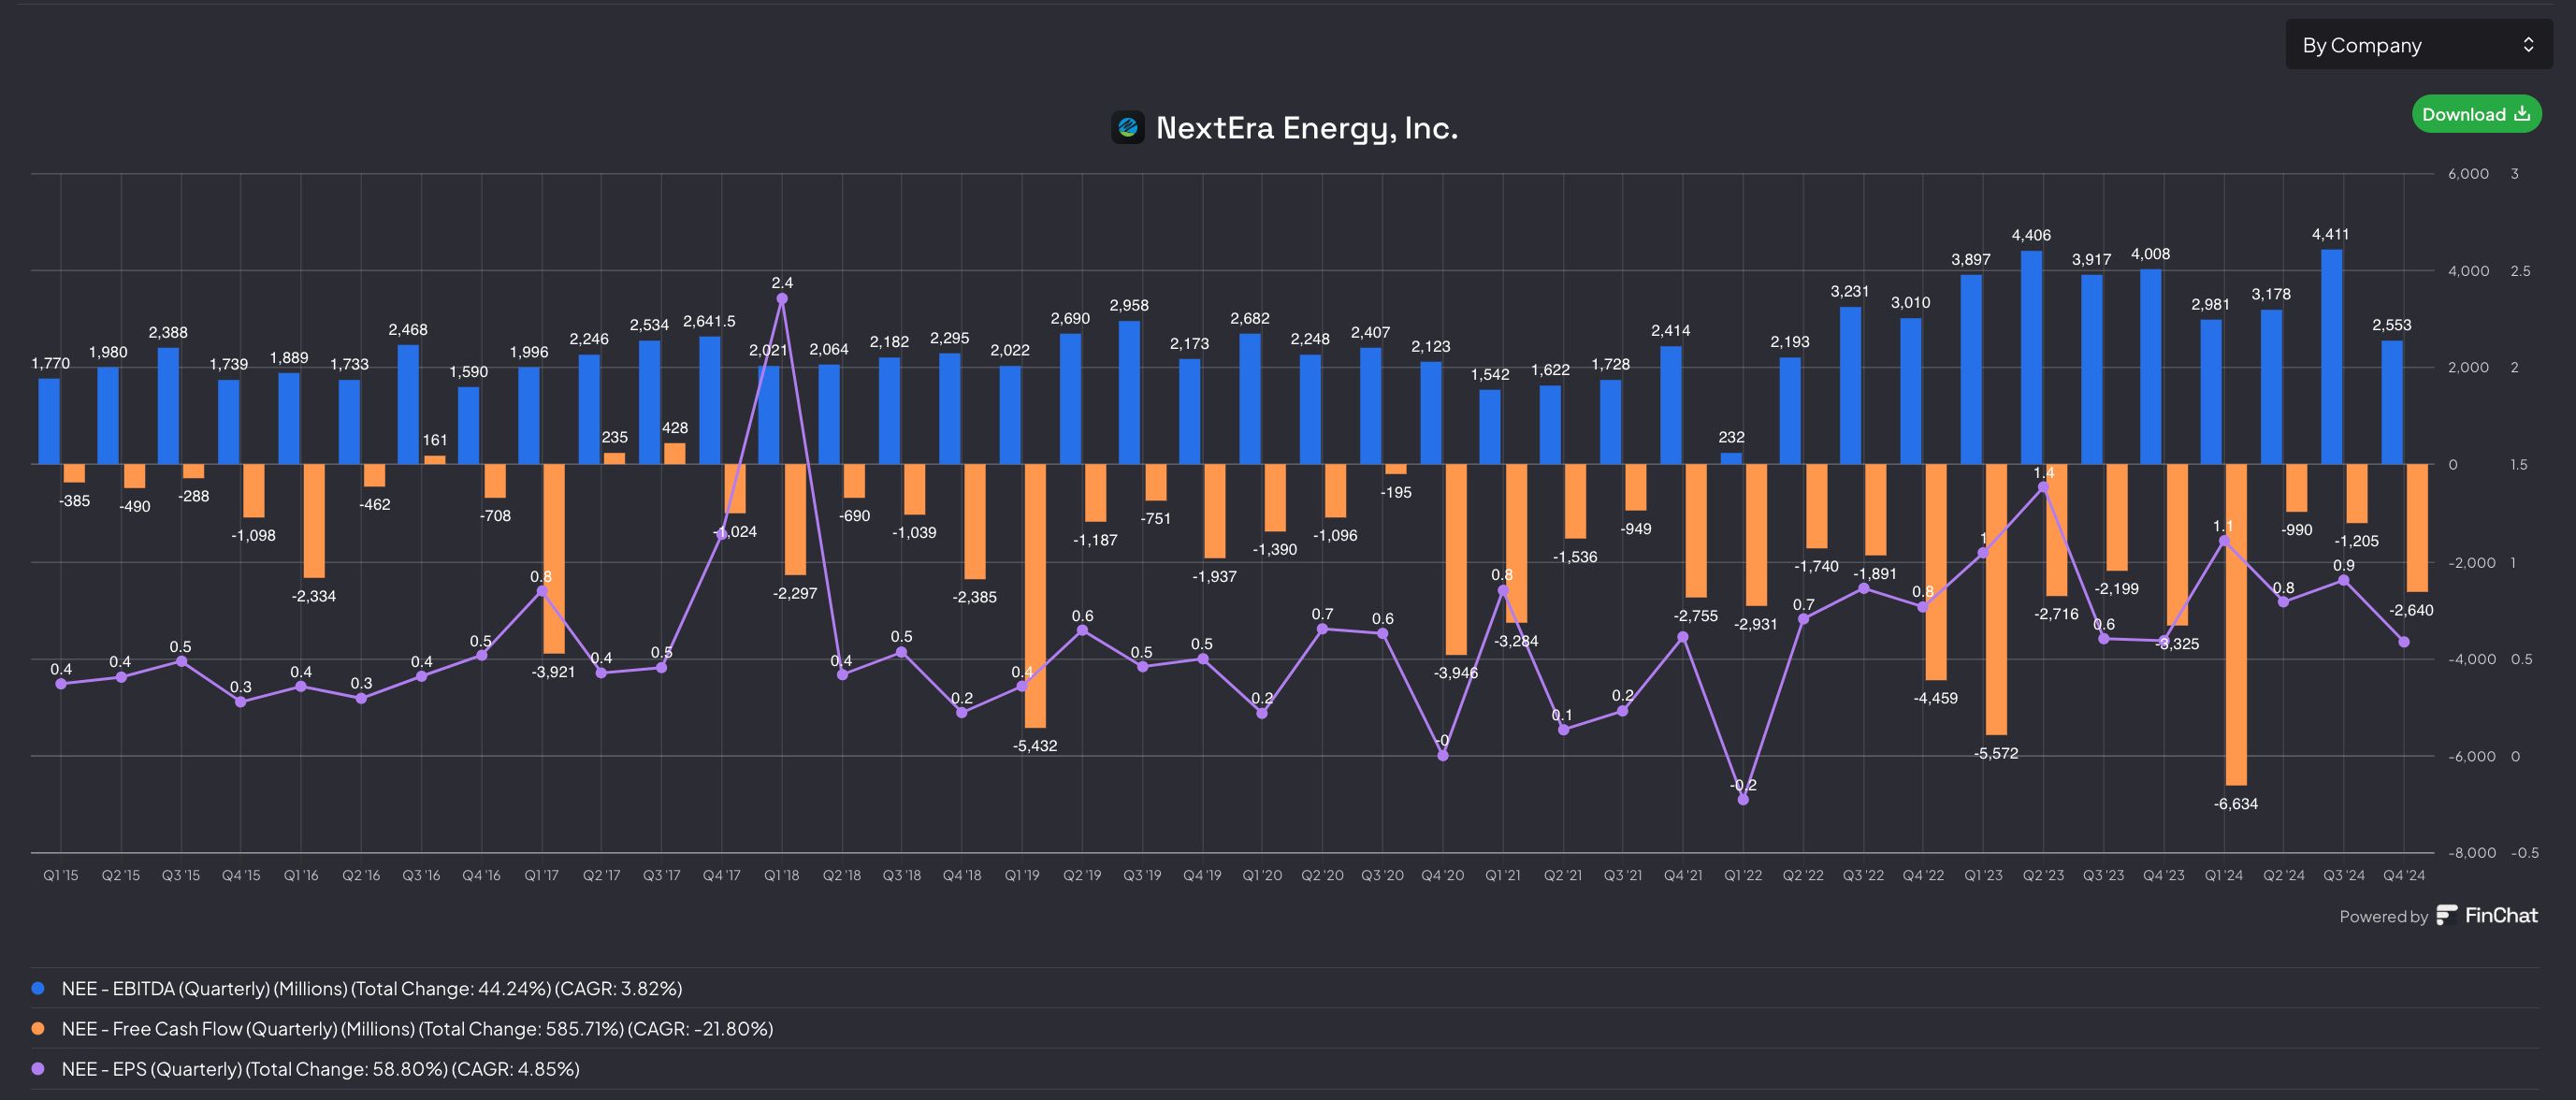
Because of these factors, EBITDA is really our gold standard for evaluating companies in this space.
Going forward, we will also be using EBITDA in our golden-child metric — EV/EBITDA. This will allow us to grasp the size of companies and their relative value (in many ways) to each other.
To give you an idea of EV/EBITDA values in our industries:

From here on out, EBITDA is what we will be using for additional ratios and metrics if possible.
B. Unit Production (Wh), Backlog, & Capacity
I wanted to follow up a broadly used metric like EBITDA with a more niche metric like Unit Production and related components. I’ve coined the term “Unit Production” to indicate a way for us to understand actual output from electricity providers. As we learned in Part 3, electricity providers measure output in “Watt-Hours (Wh)”. This is our unit. From our unit production, we can understand backlog (often measured in Wh) and capacity and subsequently utilization (unit production / capacity).
Companies report out on these metrics as KPIs, and it really is what they are focused on to better articulate results and outlook to investors.
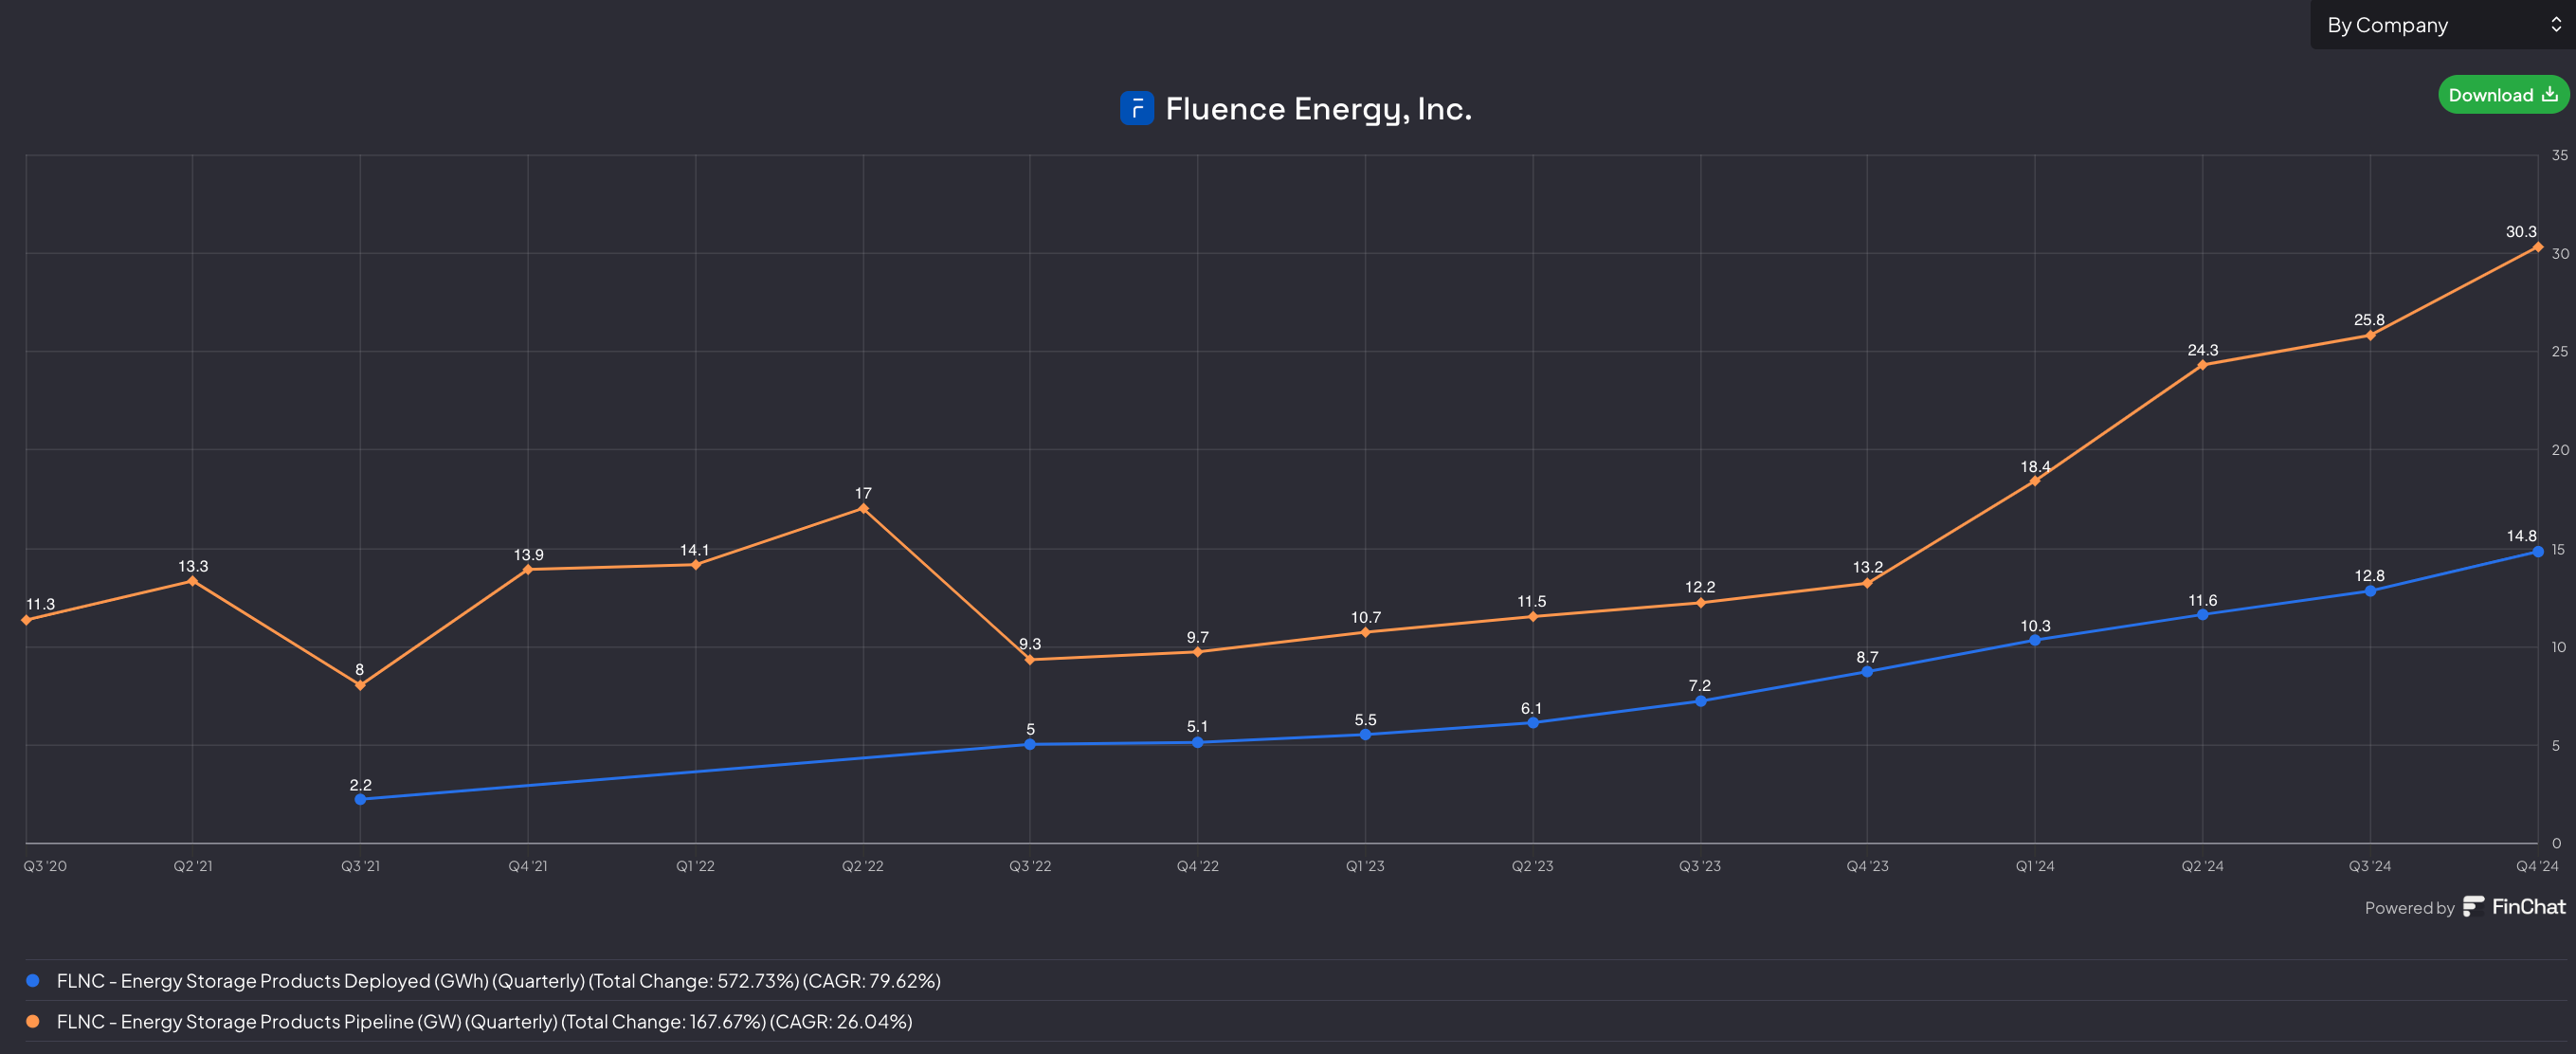
Take the graph below as an example; this graph outlines Giga Watt-Hours (Gwh) Deployed (Units Produced) and Unit Production Pipeline (GW)— the Backlog.
Our last component, utilization, we’d have to dig a bit deeper on, but it would effectively be our Unit Production over our Total Capacity (Unit Production / Total Capacity).
For the sake of understanding scale here, we could creatively constitute a metric that would take total Gwh deployment to market cap (or Enterprise Value) to get a feel for how a given company is performing operationally relative to it’s size. I believe this encompasses most of what is above.
For example, comparing NextEra Energy (NEE) to Fluence Energy (FLNC), our two companies charted above, NEE’s market cap is $146B and FLNC’s market cap is 1.5B. Total GW deployment for each were roughly (as of 2023 and as of Jan 2024, respectively) 70GW and 20GW, respectively.
As you can see, on a GW/Market Cap basis, Fluence is deploying much more effectively and is really packing a punch operationally, and that’s why this could be a great metric to track.
All in all, these metrics are important in understanding Energy companies operationally in a way that isn’t completely number-driven.
C. CAPEX + R&D
I’m going to keep this one short and simple: the Energy & Utility industries are capital-intensive.
Generally speaking, CAPEX is for more established companies that are investing in new assets or maintaining existing assets (e.g. Utilities) and R&D is for our companies that are developing new technologies (Renewables).
Again, generally speaking, both of these metrics scale with the market cap of the company.
Pair these metrics with market cap to get an idea of how much a company is investing in capital or research given their size (i.e. EV/CAPEX or EV/R&D)

D. Debt to Enterprise Value Ratio (D/EV)
Debt to enterprise value isn’t an industry-specific metric, but it happens to be very relevant in Utilities and Energy. This is best explained by ‘C’ above — these companies are heavily using debt to finance their CAPEX and R&D!
For the reasons above, debt must be monitored someway, somehow from a valuation perspective. As a simple proxy to understanding how leveraged a company is relative to it’s worth, D/EV can be used.
This metric won’t be a huge focus, but intuitively, it can and should be paired with Debt/Equity and Debt/Market Cap to get a holistic picture of companies debt burden.
I view this metric as a quick ‘check the box’ way to screen for an individual stock, where we will talk later on about more operational-focused leverage ratios that make more sense to monitor over time.
E. Interest Coverage Ratio
I can’t lie to you, I was excited to review interest coverage ratio because it’s fun to use when it applies well — and for the Energy & Utilities industries, it definitely applies.
To help you understand this ratio, I’m going to let me friend GPT do the talkin’:

For our purposes, this ratio will be especially important to monitor for companies that aren’t as established (i.e. smaller in total asset terms) and don’t have excess earnings to reinvest on capital.
As the image below indicates (ICR in the far right columns), interest coverage ratios can be all over the board:
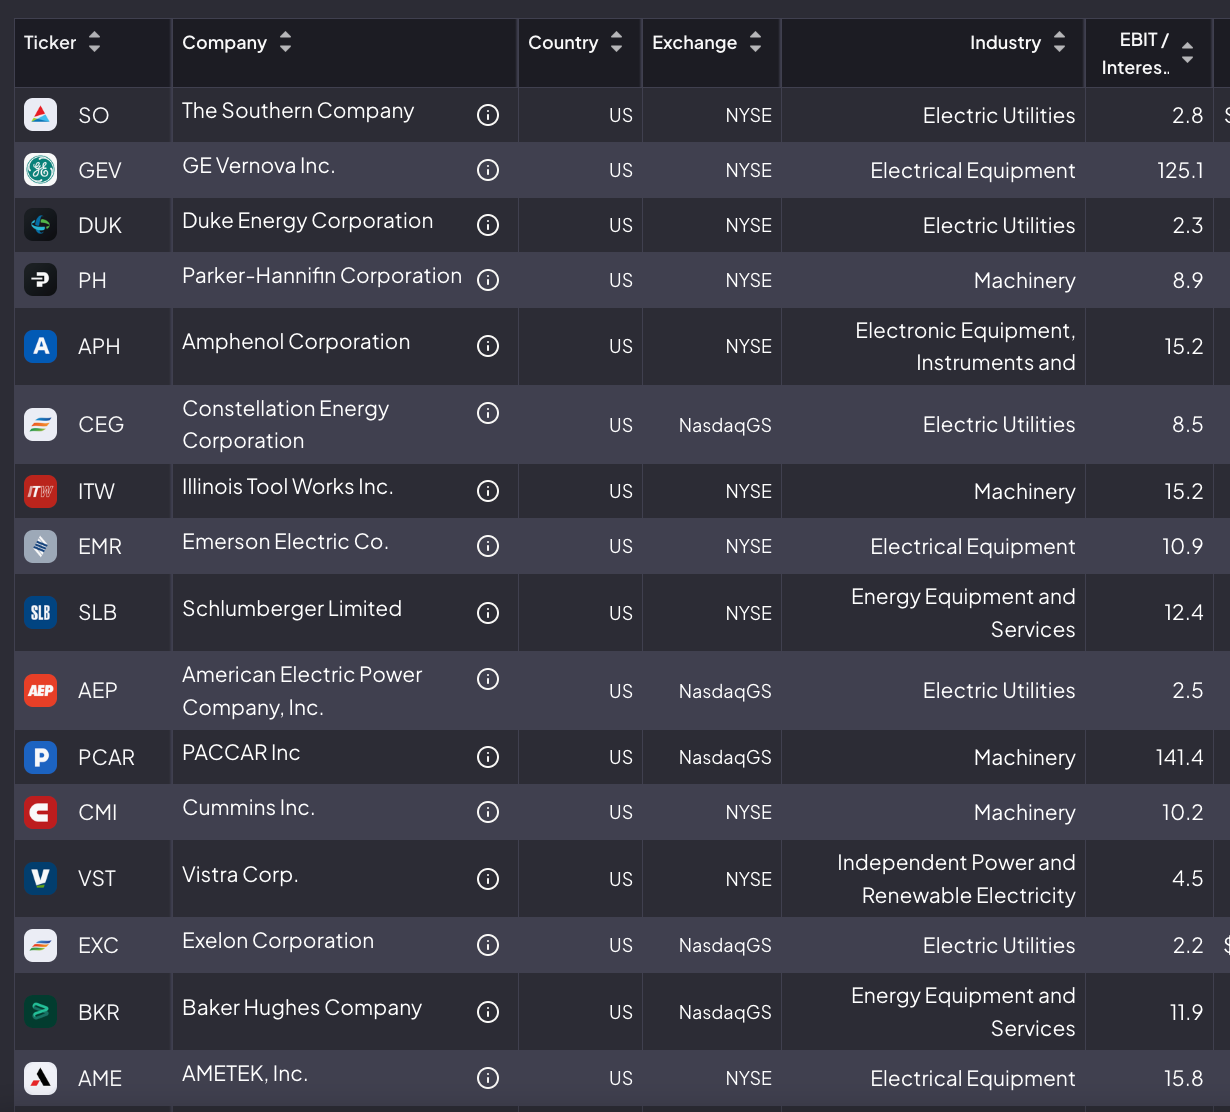
In the instance of the picture above, if a company had a low ICR, we could take a look at what these companies Debt to Equity ratio is to see if they are financing CAPEX with equity instead of debt, or even the ratio we introduced earlier, Debt/EV, to get a quick intuitive peek at if they company is potentially relying on leverage to fuel growth.
With all these pieces at play, the interest coverage ratio will be a key rolling metric to monitor to understand the solvency and financial health over time.
F. Return on Invested Capital
Return on Invested Capital (ROIC) is another metric that should be used when valuing companies in the Energy & Utility industries.
This metric allows you to get a picture of how well a company uses its profits to use all it’s capital to generate profits:
ROIC = NOPAT (Net Operating Profit After Taxes) / Invested Capital (Equity + Debt)
Expressed in percentage terms, this metric allows us to compare companies on an apples-to-apples basis. On the flip side, be wary of absolute values if you are given the ROIC and aren’t calculating itself.
Note that we are using ROIC over ROCE to include the affects of financing within the income (numerator) side of the equation. We want to factor this in because the Energy and Utility industries are debt-intensive and financing (interest) matters!
The image below shows the ROIC for some of the major players in the industries we are tracking:

BONUS METRIC
Congrats on making it this far! By now you’ll have learned a handful of metrics to help you screen companies to invest in — an invaluable long-term investment in your Energy industry knowledge and ability to pick a winner time and time again.
This last bit isn’t necessarily one specific metric, but more of a tool for you to squeeze every bit of asymmetric information out of your research.
This tool is the FinChat.io fundamentals charting tool. It allows you to choose a company and see specific KPIs and industry-segment valuation metrics for that company! Wow!
As an example, I’ve highlighted some of the metrics and KPIs for NextEra Energy in the image below:

This tool allows you to easily splice out metrics that you may not have been aware of before and track companies on what matters to them.
As a side note, FinChat is adding a feature to allow you to make custom metrics based on existing metrics that allows you to get an even more detailed picture on certain relevant metrics (e.g. cash flow per asset, for renewables). Powerful!
Challenge: Try this tool & report back on how you’ve used it creatively to track something traditional information-aggregators couldn’t have offered!
Summary
Today you learned about the following metrics that can be used to assess a company in the Energy or Utility industries:
A. EBITDA (& EV/EBITDA)
B. Unit Production (Wh), Backlog, & Capacity
C. CAPEX + R&D
D. Debt to Enterprise Value Ratio (D/EV)
E. Interest Coverage Ratio
F. Return on Invested Capital (ROIC)
H. FinChat Fundamentals Charting Tool
These metrics will be what we use going forward to screen companies effectively and monitor they performance over time. I hope you learned something about each metric and why it matters for our purposes and how each works. I encourage you to draw parallels to other industries and see how the metrics you’d uses to assess them differ from what I’ve put on show here today 🙌

In the next part of the series we will be screening companies in the Energy and Utility industries. The market is ripe with opportunities given much underlying uncertainty. I can’t wait to pick a winner (winners) with you 🔥
In Learning,
